Previous chapters:
The roulette bias winning method of García Pelayo
Betting system for biased wheels
As we can observe, if we have a thousand spins taken from a truly random table, without bias, we would hardly find the most spun number having something beyond 15 positives. Likewise, we have a soft limit for the best two numbers, the two which have been spun the most, of +26. If we continue searching for different groups of best numbers, we can center in the sum of the best nine, which have a soft limit of +67. Why the soft limit only? Because the hard limit is too erratic and luck might make a number to fire-up without actually having any bias. It is more trustworthy to work with the soft limit, which occurs 95% of the time, making decisions based on it. These tables are more reliable the larger the numerical group is. Application to a single number being more doubtful than the sum of the best six, where it is harder for luck to interfere in a decisive manner. I make the study only up to the best nine, because if there are ten or more best numbers outside the limit, it tells the table is entirely good, and this is already studied on the first part.
How do these tables complement the previous analysis? It might be the case that a roulette as a whole doesn’t goes beyond the soft limit, as we studied at the beginning, but the best four numbers do go beyond. They can be bet without much risk, awaiting to collect more data which defines with a higher accuracy the quality of the current roulette table. When a roulette is truly good, we will likewise reinforce on its quality by proving it does go outside of the limits set on these tables.
Always using simulation tests on the computer, this is, in a experimental non-theoretical way, I studied other secondary limits which assist to complete the analysis of any statistics taken from a roulette. For instance, “how many consecutive numbers, as they are ordered on the wheel, can be throwing positives?”, or “How many positives can two consecutive numbers have as a maximum?”. I do not show these tables because they are not essential and only confirm BIAS which should have been detected by the tables previously shown. Any way, we will see some practical examples below.
So far the system was based on evidence that -although simulated- was being empirical; these were made with the help of the computer in order to verify the behavior of a random roulette.
I found the limits up to where luck alone could take it, then I was able to effectuate a comparison with real-life statistics from machines which were clearly showing result outside the limits of pure chance, this is, they pointed to trends that would remain throughout its life if their materials would not suffer alterations. These physical abnormalities could be due to pockets of unequal size, however small this inequality, lateral curvatures leaving sunken areas with the counterweight of other raised areas. Or even a different screwing of the walls from the pockets collecting the ball so that a harder wall means more bounce. With the consequent loss of results that are increased in the neighboring pockets which collect these bounced balls with a higher frequency than normal.
On theoretical grounds I studied areas of mathematics unknown to me, in the probability branch, and worked a lot with the concept of variance and standard deviations. They helped me, but I could not apply them correctly given the complexity of roulette, that is more like a coin with 18 sides and 19 crosses bearing different combinatorial situations, which invalidate the study with binomials and similar.
The major theoretical discovery was forwarded to me by a nephew, who was finishing his career in physics. He referred me some problems on the randomness of a six-sided die. To do this they were using a tool called the « chi square », whose formula unraveled -with varying degrees of accuracy- the perfection or defects from each drawn series. How come nobody had applied that to roulette?
I handled myself with absolute certainty in the study of the machines, to which the fleet had already pulled out great performance up to that date, thanks to our experimental analysis, but theoretical confirmation of these analyzes would give me a comforting sense of harmony (In such situations I’m always humming «I giorni dell’arcoballeno»*.
We carefully adapt this formula to this 37-face die and it goes as follows:
The chi square of a random roulette should shed a number close to 35.33. Only 5% of the time (soft limit) a number of 50.96 can be reached -by pure luck- and only 0.01% of the time it will be able to slightly exceed the hard limit of 67.91.
We had to compare these numbers with those from the long calculations to be made on the statistics from the real wheel we were studying. How are these calculations made?
The times the first number has showed minus all tested spins divided by 37, all squared, and divided by the total of analyzed spins divided by 37.
Do not panic. Let’s suppose the first number we analyze is the 0, to follow in a clockwise direction with all other roulette numbers. Let’s suppose on a thousand spins sample number 0 has come out 30 times:
(30-1000/37) squared and the result divided by (1000/37) = 0.327
The same should be done with the following number, in this case in wheel order, proceeding with 32 and following with all roulette numbers. The total sum of results is the chi square of the table. When compared with the three figures as set out above we will find if this machine has a tendency, more or less marked, or it is a random table instead.
The calculation, done by hand, frightens by its length but using a computer it takes less than a flash.
Statistical analysis of numbers and wheel bias identification strategy
While in my experimental tests I only watched leader numbers , this chi-square test also has in mind those numbers that come out very little and also unbalance the expected result.
There was a moment of magic when I found that the results of the previous tables were perfectly in accordance with the results that the chi-square test threw.
With all these weapons for proper analysis I did a program from which, finally, we’ll see some illustrations:
TOTAL POSITIVE + 127 HIGHER + 24 L1 + 41 L2 + 70 L3 + 94 L4 + 113
LB + 174 A + 353 B + 243 C + 195 NA 4 AG 60 AD 46 N.° P 12 SPINS 10.000
CHI 37,18 50,96 67,91 35,33 DV-7,51 ROULETTE/DAY: RANDOM
*LB = Límite blando = Soft limit.
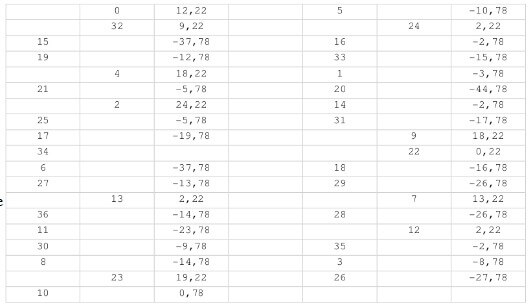
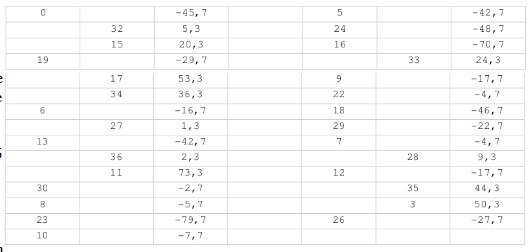
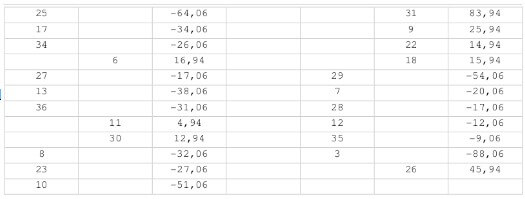
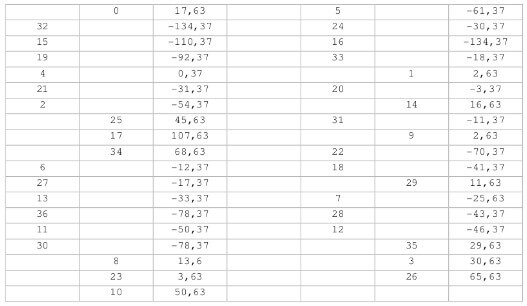
In this chart I created throwing 10,000 spins to simulate a random table, we can find all patterns of randomness; this will serve to compare with other real tables we’ll see later.
In the bottom of the table, to the left at two columns, there are all European roulette numbers placed on its actual disposition starting at 0 and continuing in clockwise direction (0, 32 15, 19, 4, 21, 2, 25, etc.). We highlighted those which have appeared more, not only based on their probability, which is one time out of 37, but also based on the need to profit, i.e. more than once every 36.
If the average to not lose with any number would be 1.000/36 = 27.77, our 0 has come out forty times; therefore it is on 40, to which we subtract 27.77 = 12.22. Which are its positives, or extra shows; therefore we would have gain. When 20 is – 4 4, 7 8 it is the number of chips lost on the 10,000 spins thrown.
In the first row we find the total positive sum of all the lucky numbers is +127 (the mean of a random table in our first table is +126), away from the soft limit* (*Soft limit = Límite blando = LB), which is at the beginning of the second row, and which for that amount of spins is +174. Next to it is the reference of known biased tables, (All taken from the first table) which shows that even the weakest (table C) with +195 is far from the poor performance which begins to demonstrate that we are in front of a random table where drawn numbers have come out by accident, so it will possibly be others tomorrow.
Returning to the first row we see that our best number has +24 (it is 2) but that the limit for a single number ( L l ) is +41, so it is quite normal that 2 has obtained that amount, which is not significant. If we want to take more into account we are indicated with L2, L3 and L4 the limits of the two, three and four best numbers, as we saw in the second tables (our two best would be 2 and 4 for a total of +42 when their limit should be +70). Nothing at all for this part.
In the middle of the second row NA 4 it means that it is difficult to have over four continuous single numbers bearing positives (we only have two). AG 60 tells us that the sum of positives from continuous numbers is not likely to pass sixty (in our case 0 and 32 make up only +21). AD 46 is a particular case of the sum of the top two adjacent numbers (likewise 0 and 32 do not reach half that limit). After pointing out the amount of numbers with positives (there are 12) and the 10,000 spins studied we move to the next row which opens with the chi square of the table.
In this case 37,18 serves for comparison with the three fixed figures as follow: 50.96 (soft limit of chi), 67.91 (hard limit) and 35.33 which is a normal random table. It is clear again that’s what we have.
Follows DV-751 which is the usual disadvantage with these spins each number must accumulate (what the casino wins). Those circa this amount (the case of 3) have come out as the probability of one in 37 dictates, but not the one in 36 required to break even. We conclude with the name given to the table.
From this roulette’s expected mediocrity now we move to analyze the best table that we will see in these examples. As all of the following are real tables we played (in this case our friends “the submarines” *) in the same casino and on the same dates. The best, table Four:
(* Note: “Submarines” is the euphemism used by Pelayo to name the hidden players from his team).
TOTAL POSITIVES + 363 HIGHER + 73 L1 + 46 L2 + 78 L3 + 105 L4 + 126
LB + 185 A + 447 B + 299 C + 231 NA 4 AG 66 AD 52 N.° P 13 SPINS 13.093
CHI 129,46 50,96 67,91 35,33 DV-9,83 ROULETTE/DAY: 4-11-7
What a difference! Here almost everything is out of the limits: the positive (+363) away from the soft limit of 185. The table does not reach A but goes well beyond the category of B. The formidable 129.46 chi, very far from the fixed hard limit of 67.91 gives us absolute mathematical certainty of the very strong trends this machine experience. The magnificent 11 with +73 reaches a much higher limit of a number (L1 46), 11 and 17 break the L2, if we add 3 they break the L3, along with 35 they break the L4 with a whopping +221 to fulminate the L4 (126). It doesn’t beat the mark for contiguous numbers with positives (NA 4), because we only have two, but AG 66 is pulverized by the best group: 35 and 3,along with that formed by 17 and 37, as well as the one by 36 and 11. The contiguous numbers that are marked as AD 52 are again beaten by no less than the exact three same groups, showing themselves as very safe. Finally it must be noted that the large negative groups ranging from 30 to 16 and 31 to 7 appear to be the mounds that reject the ball, especially after seeing them in the graph on the same arrangement as found in the wheel.
Playing all positive numbers (perhaps without the 27) we get about 25 positive gain in one thousand played spin (the table is between B and A, with 20 and 30 positives of expectation in each case). It is practically impossible not winning playing these for a thousand spins, which would take a week.
Another question is chip value, depending on the bank we have. My advice: value each chip to a thousandth of the bank. If you have 30,000 euros, 30 euros for each unit. These based on the famous calculations of “Ruin theory” precisely to avoid ruining during a rough patch.
Another interesting table for us, the Seven:
TOTAL POSITIVES + 294 HIGHER + 83 L1 + 56 L2 + 94 L3 + 126 L4 + 151
LB + 198 A + 713 B + 452 C + 325 NA 4 AG 77 AD 62 N.° P 13 SPINS 21.602
CHI 77,48 50,96 67,91 35,33 DV-16,22 ROUILETTE/DAY: 7-9-3
This table seven, with many spins, is out of bounds in positives and chi, but the quality is less than C. It has, however, a large area ranging from 20 to 18 having almost +200 by itself, that breaks all NA, AG and AD, which while being secondary measures have value here. No doubt there’s something, especially when compared with the lousy zone it is faced with from 4 to 34 (I wouldn’t save the 21). Here should be a “downhill area” which is detected in this almost radiography. The slope seems to end at the magnificent 31. Also add the 26. Finally, a typical roulette worth less than average but more than B and C which is out of bounds with three well defined areas that give a great tranquility since even as it doesn’t has excessive quality, with many balls it becomes very safe.
Table Eight:
TOTAL POSITIVES + 466 HIGHER + 107 L1 + 59 L2 + 99 L3 + 134 L4 + 161
LB + 200 A + 839 B + 526 C + 372 NA 4 AG 83 AD 73 N.° P 14 SPINS 25.645
CHI 155,71 50,96 67,91 35,33 DV-19,26 ROULETTE/DAY: 8-12-7
It is the first time that we publish these authentic soul radiographies of roulette. My furthest desire is not to encourage anyone who, misunderstanding this annex, plays happily the hot numbers on a roulette as seen out while dining. That’s not significant and I certainly do not look forward to increase the profits of the casinos with players who believe they are practicing a foolproof system. It takes many spins to be sure of the advantage of some numbers. Do no play before.
Be vigilant when you find a gem to detect they do not touch or modify it in part or its entirety. If this happens (which is illegal but no one prevents it), your have to re-study it as if it were a new one.
Regardless of how much advantage you have (and these roulette tables are around 6% advantage, ie, more than double the 2.7% theoretical advantage of the casino) it does not hurt that luck helps. I wish so to you.